Service Status Page
Revision 4
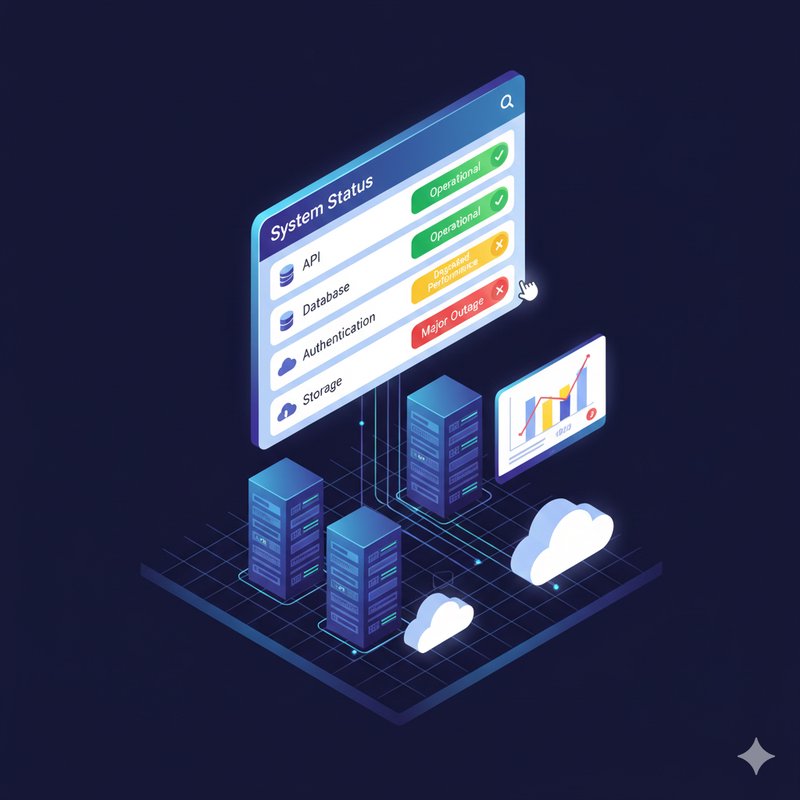
Your own self-hosted status page — no Statuspage.io subscription, no YAML pipelines, no cron jobs ssh-ing into a VPS. Just a visual flow that pings your endpoints, persists state, and serves a live dashboard over HTTP.
## What happens under the hood
1. **Ticker** wakes up every 30s and emits the full endpoint manifest from its context.
2. **Split** iterates the array, fanning out one message per endpoint — parallel health checks without a single goroutine in sight.
3. **HTTP Client** fires a GET against each URL. 2xx = UP, anything else (including timeouts) = DOWN.
4. **KV Store** upserts the result keyed by endpoint ID into TinyNode metadata — survives pod restarts, no external database required.
5. On inbound HTTP request: **HTTP Server** catches it, **Router** matches the path, **KV Store** dumps all entries, and **Go Template** renders a server-side HTML page. The response travels back up the blocking I/O chain to the waiting client. Zero JavaScript on the frontend.
## Setup
1. Import this project.
2. Edit the Ticker settings to define your endpoints — each one needs an `id`, `name`, and `url`.
3. Start the Ticker. Health checks begin immediately; the HTTP Server spins up on its configured port.
4. Hit the server URL. That's it — you're looking at your status page.
## Knobs to turn
- **Check interval**: Ticker delay in ms. Default is 30000 (30s). Set it to 5000 if you enjoy watching paint dry in real-time.
- **Endpoints**: Add/remove entries in the Ticker context. The schema propagates through edges, so downstream nodes adapt automatically.
- **Dashboard HTML**: The Go Template settings contain the full page markup. Tweak it, add CSS, make it brutalist — it's your status page.
- **Selective queries**: Wire a JSONPath filter into the KV query port (e.g., `$.status == 'DOWN'`) to build an incidents-only view or trigger alerts.
Install with AI
$ claude
> Install the "Service Status Page" agent into my cluster